Difference between revisions of "Paint dynamics specification"
From GIMP GUI Redesign
(New page: not a spec yet, just a lash-up to begin with… the new dockable: Image:Dockable2.png some notes: * the pop-up list at the top has all the inputs and outputs listed in two sections...) |
|||
| Line 14: | Line 14: | ||
* the min/max triangles on the right of the curves track the min and max of the highlighted curve; dragging one of the triangles itself moves the min or max of the curve and scales the whole curve; | * the min/max triangles on the right of the curves track the min and max of the highlighted curve; dragging one of the triangles itself moves the min or max of the curve and scales the whole curve; | ||
* the ‘Show input checkbox’ enables the tracking of '''the''' input (either the one selected in the pop-up or highlighted in the scrolling list) in a way similar as the color sampling is shown in the Curves dialog (vertical line at current value); | * the ‘Show input checkbox’ enables the tracking of '''the''' input (either the one selected in the pop-up or highlighted in the scrolling list) in a way similar as the color sampling is shown in the Curves dialog (vertical line at current value); | ||
| + | |||
| + | more on the toll options soon… | ||
Revision as of 22:46, 24 June 2009
not a spec yet, just a lash-up to begin with…
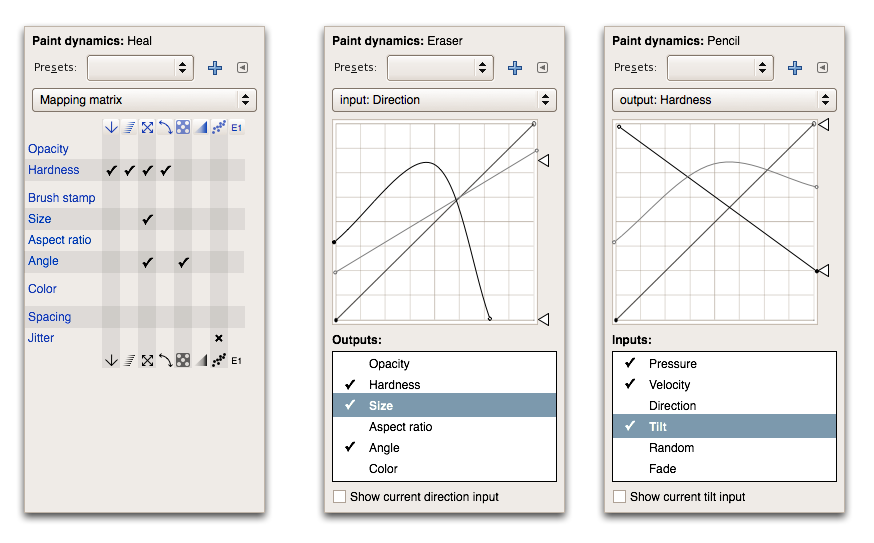
the new dockable:
some notes:
- the pop-up list at the top has all the inputs and outputs listed in two sections. it addresses the questions: “what does this input control?” and “what control this output?”
- depending if at the top an input or an out put is chosen, all valid outputs or input are shown in the scrolling list at the bottom;
- the scrolling list has checkboxes on the left to switch on/off a input->output mapping;
- only curves for mappings that are on are shown
- the highlighted and on mapping is editable as a curve, its line color is fg (black here), all other curver are 50% fg/bg (grey here);
- the min/max triangles on the right of the curves track the min and max of the highlighted curve; dragging one of the triangles itself moves the min or max of the curve and scales the whole curve;
- the ‘Show input checkbox’ enables the tracking of the input (either the one selected in the pop-up or highlighted in the scrolling list) in a way similar as the color sampling is shown in the Curves dialog (vertical line at current value);
more on the toll options soon…
